
🎓 Welcome to ChampExcel Masterclasses
Looking to master specific Excel and Data skills? You’re at the right place!
This page is your gateway to our exclusive Masterclass Collection — featuring 15+ expert-led courses, each focused on a specific topic to help you deep dive and truly master it.
💡 Why Join Our Masterclasses?
✅ 365 Days Unlimited Access
✅ Downloadable Working Files
✅ Certificate of Completion
✅ WhatsApp Support for Queries
✅ Eligible for Exclusive Future Discounts
Whether you're looking to upskill in Advanced Excel, Power Pivot, Macros & VBA, or the latest Excel 365 functions — there’s a Masterclass here just for you.
Explore. Learn. Grow. 💼


Excel 365 Magic: Master New Functions & Boost Productivity
Unlock the magic of Excel 365 by mastering powerful new functions designed to simplify your work. Learn how to automate tasks, analyze data faster, and create smarter formulas. Boost productivity, save time, and handle complex spreadsheets with confidence using modern Excel features.
Excel Basic to Advanced (Hindi)
Master Excel from scratch — starting with basic formulas, formatting, and charts, then progressing to pivot tables, advanced functions, dashboards, data analysis, and automation techniques. Perfect for students, professionals, and business users, this comprehensive course builds a strong foundation and equips you with real-world Excel skills to boost productivity and decision-making.
Excel Macros & VBA
Macros and VBA (Visual Basic for Applications) in Excel automate repetitive tasks. Learn to record macros and write simple VBA code to save time, boost productivity, and customize Excel workflows.
Vlookup to Xlookup
XLOOKUP replaces VLOOKUP with more flexibility. Unlike VLOOKUP, it searches both left and right, supports exact match by default, and handles missing values more efficiently with simplified, cleaner syntax.
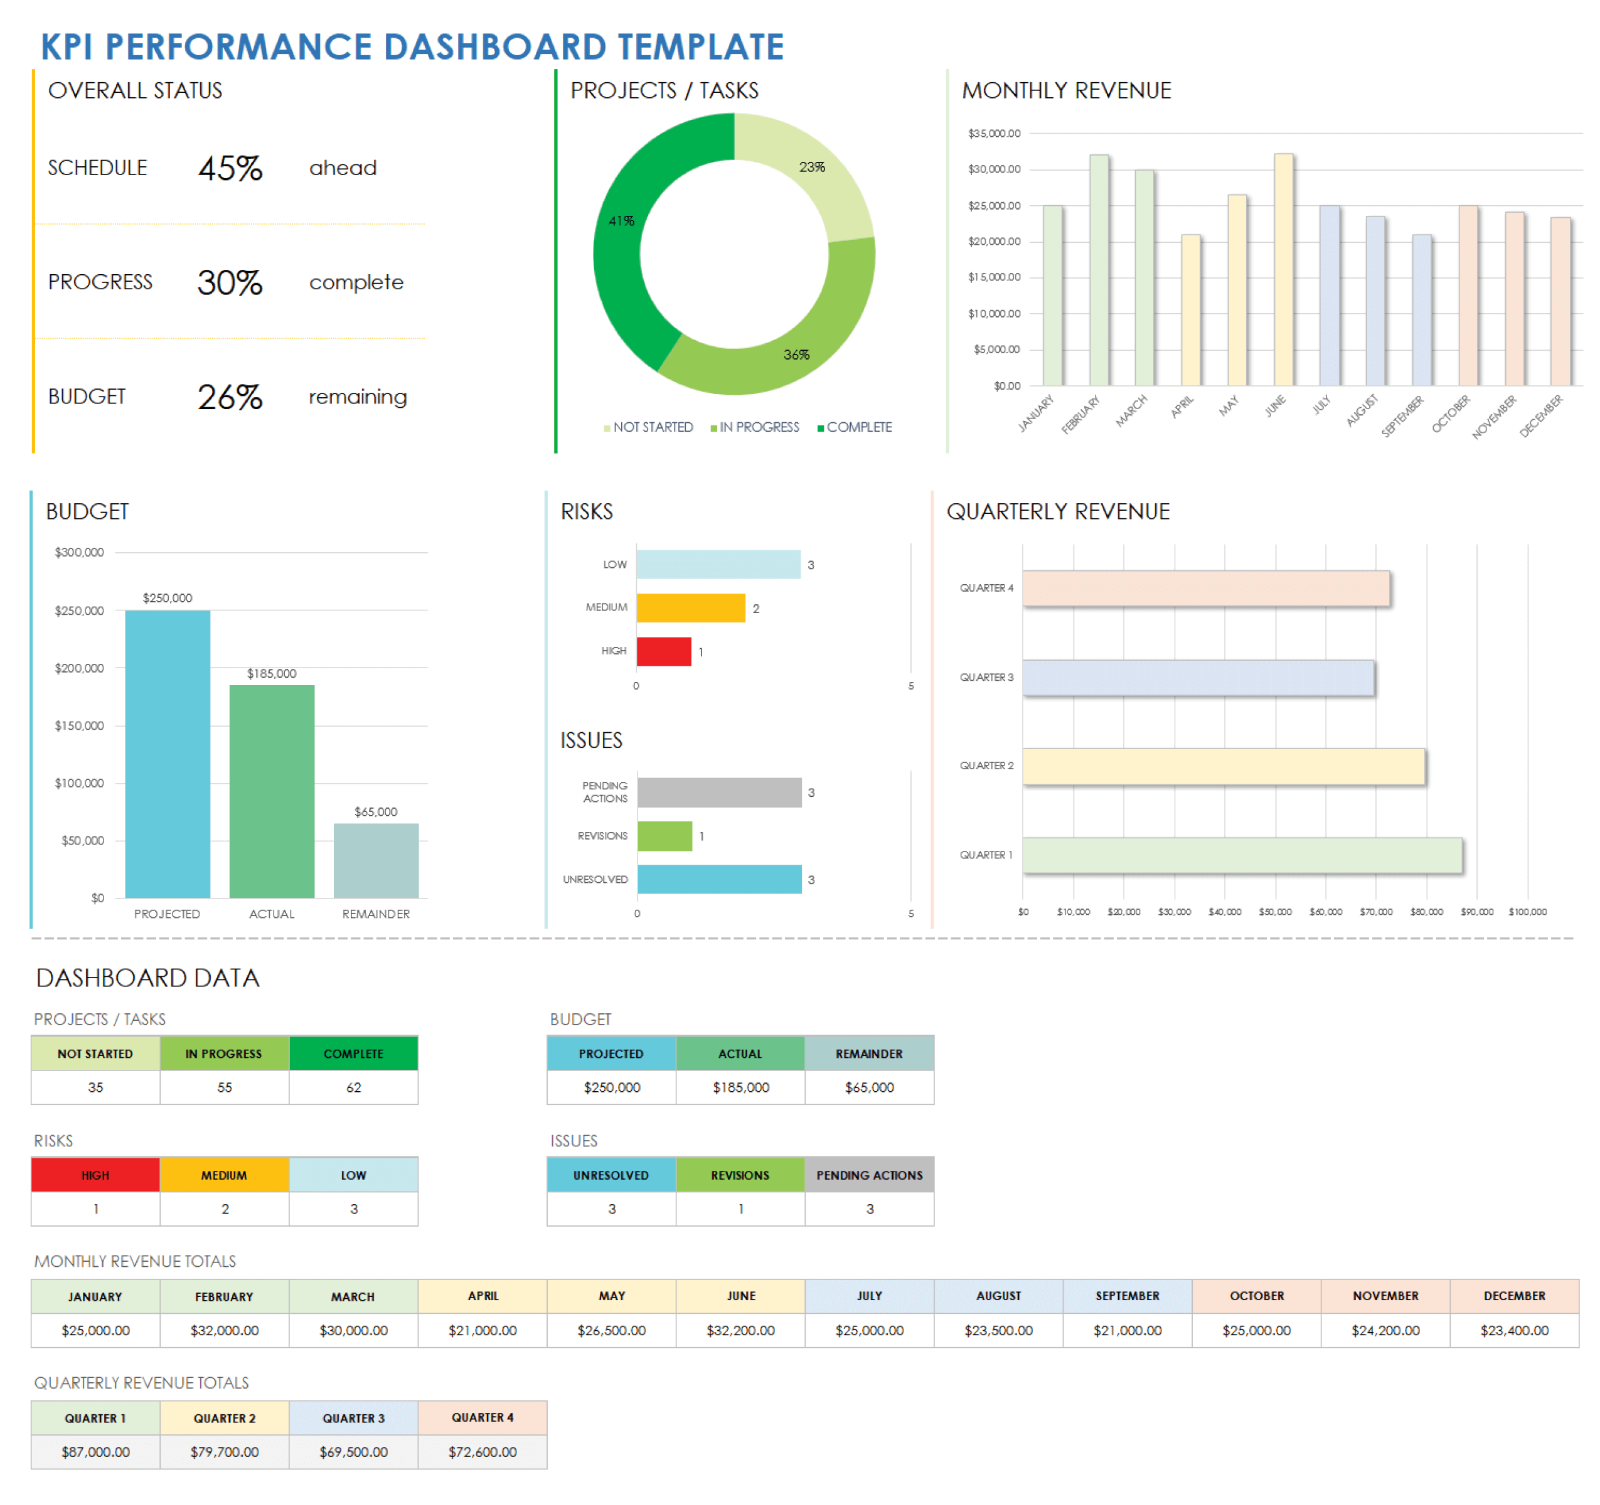
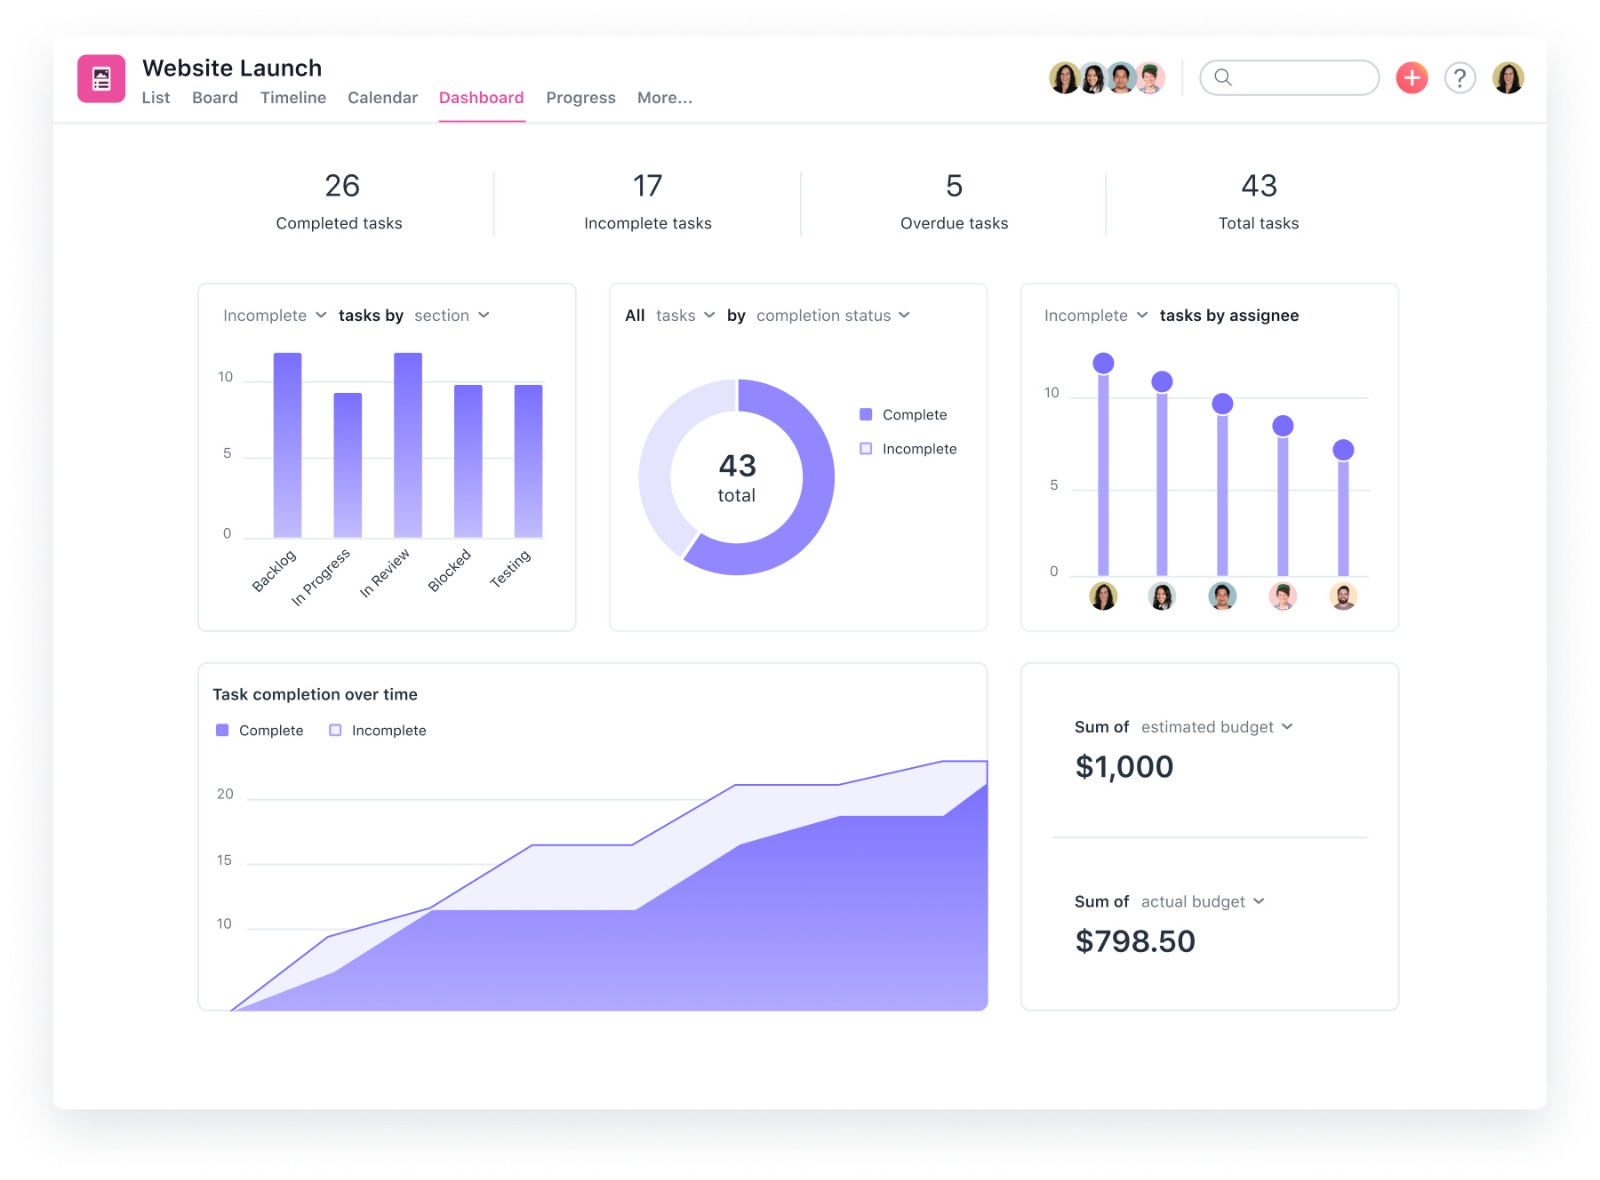
Performace Trakcer Dashboard
A Performance Tracker Dashboard visually monitors key metrics, targets, and achievements. It helps track progress, identify gaps, and make data-driven decisions to improve team or individual performance over time.
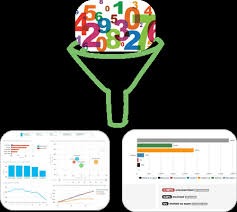
Filter 365 - Powerful Formula
Filter 365 in Excel enables users to extract and display unique or specific data subsets based on complex criteria. Unlike basic filtering, it supports multiple conditions and copying filtered results to a new location, making it ideal for detailed data analysis and report generation without altering the original dataset.

Automation - MIS
Automation in MIS (Management Information System) streamlines data collection, reporting, and analysis. It reduces manual work, improves accuracy, saves time, and delivers real-time insights for faster and smarter business decisions.

Advanced Functions of OFFICE 365
Advanced Functions of Office 365 offer powerful tools like XLOOKUP, FILTER, SORT, UNIQUE, TEXTSPLIT, PIVOTBY, VSTACK, HSTACK — designed to automate tasks, analyze data efficiently, and boost productivity with dynamic, flexible formulas. These functions help transform the way you work with data in Excel, making reporting faster and smarter.

14 Functions to Manipulate Text & Array in Excel 365
You will learn 14 powerful functions in Excel 365 that allow you to work with text and arrays efficiently. These functions help you organize, clean, and analyze data more easily. By mastering these tools, you can automate tasks, improve productivity, and handle complex data operations with greater speed and accuracy in your daily Excel work.

Xlookup - Excel 365 Formula
XLOOKUP is a modern replacement for VLOOKUP that provides greater flexibility and efficiency. It can search for data both to the left and right of the lookup column, unlike VLOOKUP. It also performs exact matches by default and includes a built-in option to handle missing values, making formulas simpler, cleaner, and easier to manage.
Charts & Dashboarding
Learn how to transform raw data into visual stories using Excel’s powerful charting tools and interactive dashboards. Master bar, line, pie, combo, and dynamic charts. Build automated, real-time dashboards using slicers, pivot charts, and formulas. Ideal for making smart business reports that are clear, impactful, and easy to understand. Perfect for analysts, managers, and anyone who presents data.
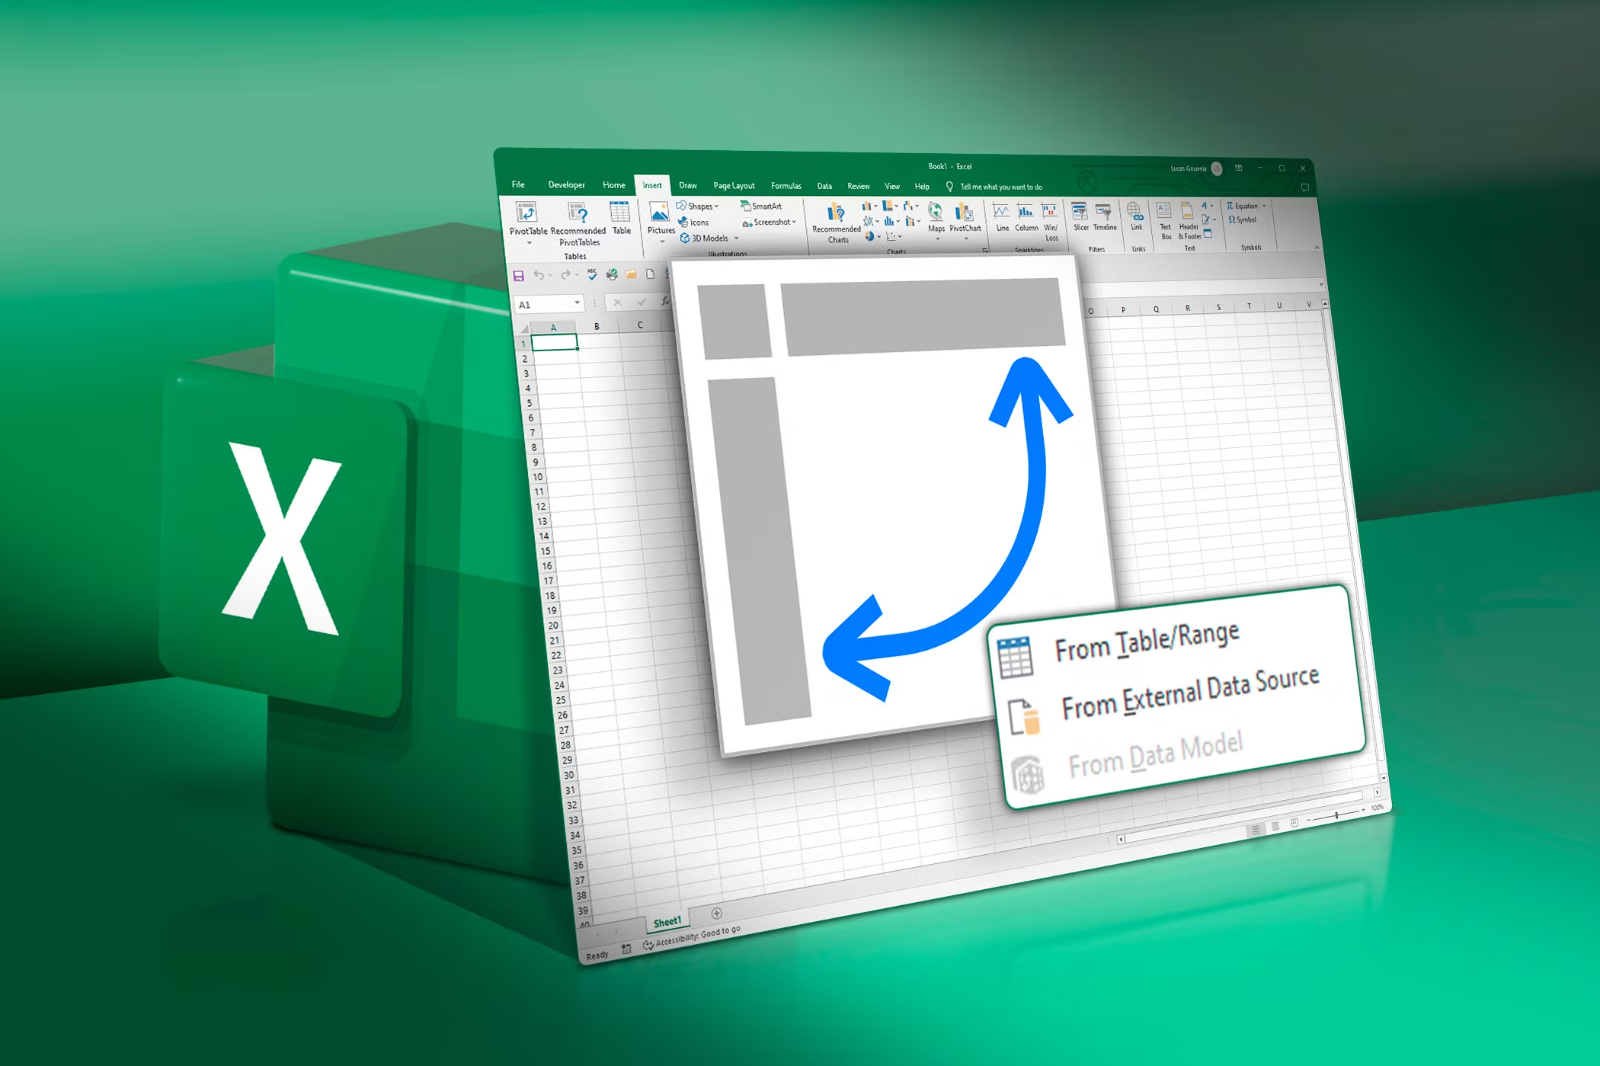
Pivot Table
Master the power of Pivot Tables to summarize, analyze, and explore large data sets with ease. Learn to group, filter, and slice data dynamically, create meaningful reports, and generate instant business insights. Perfect for making interactive summaries, tracking KPIs, and turning raw data into valuable decisions — all without writing a single formula!

Basic to Advance Excel - In English
Master Excel from scratch — starting with basic formulas, formatting, and charts, then progressing to pivot tables, advanced functions, dashboards, data analysis, and automation techniques. Perfect for students, professionals, and business users, this comprehensive course builds a strong foundation and equips you with real-world Excel skills to boost productivity and decision-making.

Power Pivot
Power Pivot is a powerful Excel add-in that allows users to create advanced data models by importing large datasets, defining relationships, and using DAX formulas to build dynamic calculations for insightful business analysis.
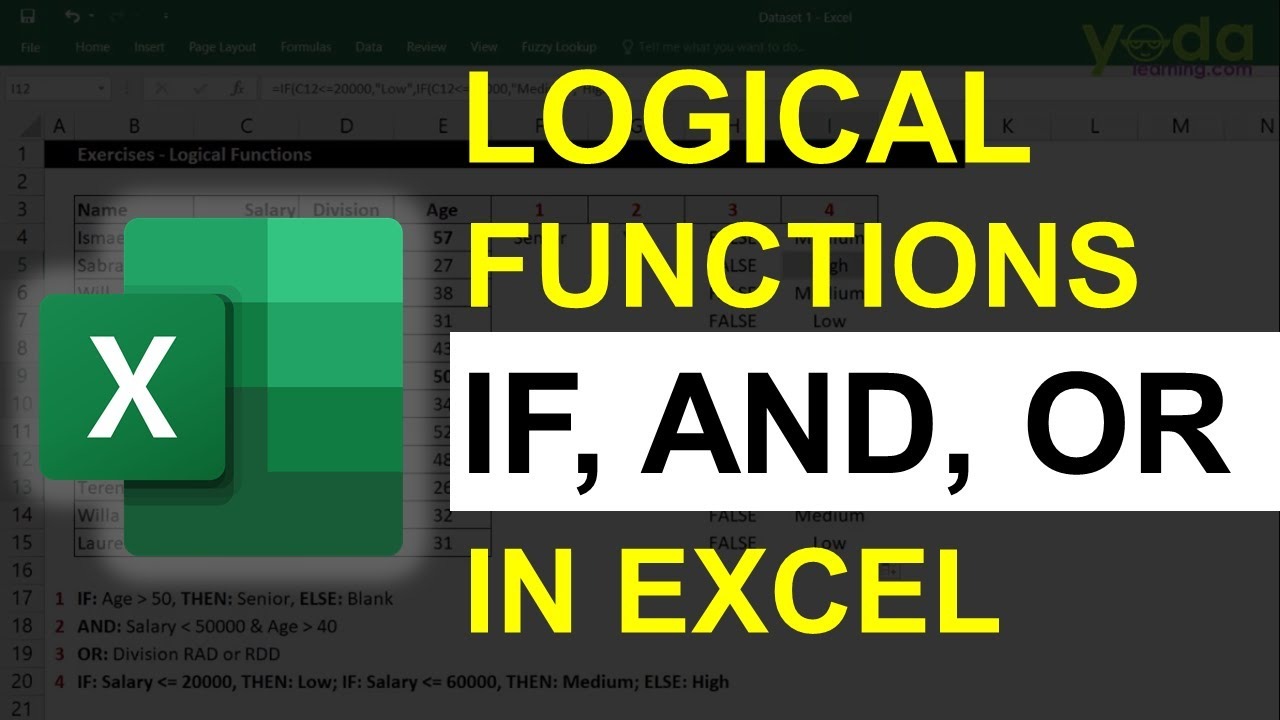
Logical Formula
Logical formulas use operators like AND, OR, and NOT to test conditions, return TRUE or FALSE, and help create decision-making rules, automate tasks, and analyze data effectively in spreadsheets and programming.

Text Formula
Text formulas manipulate and transform strings by combining, extracting, replacing, or formatting text. Functions like CONCATENATE, LEFT, RIGHT, MID, TRIM, and UPPER help clean and organize data in spreadsheets efficiently.

Advanced Filter
Advanced Filter in Excel enables users to extract and display unique or specific data subsets based on complex criteria. Unlike basic filtering, it supports multiple conditions and copying filtered results to a new location, making it ideal for detailed data analysis and report generation without altering the original dataset.

Vlookup
VLOOKUP is a powerful Excel function used to search for a value in the first column of a table and return a corresponding value from another column in the same row. It’s widely used for data lookup, merging tables, and cross-referencing information, simplifying data retrieval in complex spreadsheets.
Conditional Formatting
Conditional Formatting in Excel allows you to automatically apply formatting—such as colors, icons, or data bars—to cells based on specific criteria. This visual technique helps highlight trends, identify outliers, or emphasize important data points, making it easier to analyze large datasets quickly without manually scanning through the values.

Date & Time
Date & Time functions in Excel help manage and calculate values related to dates and times. Functions like TODAY, NOW, DATE, TIME, YEAR, MONTH, and HOUR enable users to perform scheduling, track deadlines, calculate durations, and automate time-sensitive data analysis.

Solver & Goal Seek
Solver and Goal Seek are powerful Excel tools used for optimization and what-if analysis. Goal Seek adjusts one variable to achieve a desired result, while Solver can handle multiple variables and constraints to find the optimal solution, making them invaluable for financial modeling, resource planning, and decision-making.
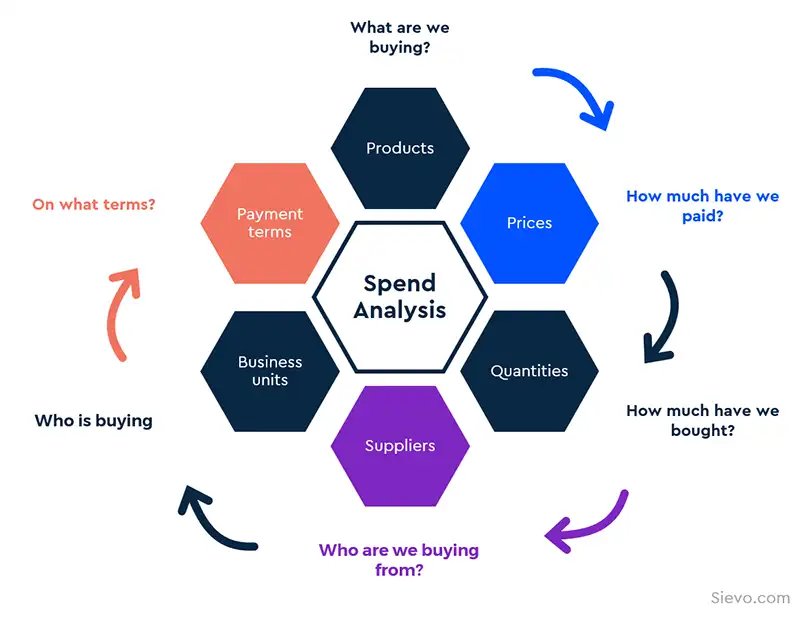
Spend Analysis
Spend Analysis is the process of reviewing and evaluating an organization’s expenditure data to identify spending patterns, opportunities for cost savings, and areas for improved budgeting. By categorizing and analyzing spend data, businesses can make informed decisions to optimize procurement and control costs effectively.